10 Ellie Taylor

-
- Height:
- 5-9
-
- Year:
- Jr.
-
- Hometown:
- Midland, Mich.
-
- High School:
- Dow / St. Louis
-
- Position:
- G
-
- gp
- 24
-
- pts/g
- 11.0
-
- fg %
- 37.5
-
- 3pt %
- 35.5
-
- ft %
- 71.7
-
- reb/g
- 5.4
-
- a/g
- 1.6
Player Profile
| Overall | Conf | |||
|---|---|---|---|---|
| Games | 24 | 20 | ||
| Games started | 22 | 20 | ||
| Minutes | 728 | 624 | ||
| Minutes per game | 30.3 | 31.2 | ||
| FG | 93-248 | 71-201 | ||
| FG Pct | 37.5 | 35.3 | ||
| 3PT | 44-124 | 33-99 | ||
| 3PT Pct | 35.5 | 33.3 | ||
| FT | 33-46 | 27-38 | ||
| FT Pct | 71.7 | 71.1 | ||
| Off rebounds | 25 | 22 | ||
| Def rebounds | 104 | 92 | ||
| Total rebounds | 129 | 114 | ||
| Rebounds per game | 5.4 | 5.7 | ||
| Personal fouls | 44 | 37 | ||
| Disqualifications | 1 | 1 | ||
| Assists | 39 | 34 | ||
| Turnovers | 38 | 29 | ||
| Assist to turnover ratio | 1.0 | 1.2 | ||
| Steals | 26 | 24 | ||
| Blocks | 5 | 5 | ||
| Points | 263 | 202 | ||
| Points per game | 11.0 | 10.1 | ||
| Points per 40 min | 14.5 | 12.9 | ||
Game Log - Shooting
| Date | Opponent | Score | gs | min | fg | pct | 3pt | pct | ft | pct | pts |
|---|---|---|---|---|---|---|---|---|---|---|---|
| Oct 30 | at Michigan | L, 97-46 | - | - | - | - | - | - | - | - | - |
| Nov 8 | at Findlay | L, 71-61 | - | - | - | - | - | - | - | - | - |
| Nov 10 | at Hillsdale | L, 80-71 | - | - | - | - | - | - | - | - | - |
| Nov 16 | Lewis | L, 72-64 | - | - | - | - | - | - | - | - | - |
| Nov 23 | Ursuline | W, 94-83 | - | - | - | - | - | - | - | - | - |
| Nov 26 | at Ohio Dominican | L, 76-66 | - | 25 | 7-12 | 58.3 | 3-6 | 50.0 | 0-0 | - | 17 |
| Nov 27 | at Cedarville | L, 84-62 | - | 20 | 0-2 | 0.0 | 0-2 | 0.0 | 0-0 | - | 0 |
| Nov 30 | Indianapolis | L, 62-58 | 1 | 31 | 8-21 | 38.1 | 4-10 | 40.0 | 2-2 | 100.0 | 22 |
| Dec 5 | at Northern Mich. | L, 55-47 | 1 | 31 | 6-11 | 54.5 | 2-3 | 66.7 | 6-6 | 100.0 | 20 |
| Dec 7 | at Michigan Tech | L, 69-46 | 1 | 29 | 5-11 | 45.5 | 1-3 | 33.3 | 4-4 | 100.0 | 15 |
| Dec 15 | Saginaw Valley | L, 58-52 | 1 | 34 | 6-15 | 40.0 | 2-8 | 25.0 | 1-2 | 50.0 | 15 |
| Dec 21 | Lawrence Tech | W, 71-52 | 1 | 28 | 7-12 | 58.3 | 4-7 | 57.1 | 4-6 | 66.7 | 22 |
| Jan 2 | Parkside | L, 65-55 | 1 | 32 | 4-11 | 36.4 | 1-2 | 50.0 | 1-1 | 100.0 | 10 |
| Jan 4 | at Purdue Northwest | L, 61-52 | 1 | 30 | 2-7 | 28.6 | 1-5 | 20.0 | 0-0 | - | 5 |
| Jan 9 | Ferris St. | L, 75-64 | 1 | 35 | 7-15 | 46.7 | 5-8 | 62.5 | 1-2 | 50.0 | 20 |
| Jan 11 | Lake Superior St. | W, 52-42 | 1 | 33 | 2-8 | 25.0 | 1-5 | 20.0 | 2-2 | 100.0 | 7 |
| Jan 16 | at Grand Valley St. | L, 74-35 | 1 | 20 | 0-6 | 0.0 | 0-4 | 0.0 | 0-0 | - | 0 |
| Jan 18 | Davenport | W, 64-39 | 1 | 29 | 3-14 | 21.4 | 1-6 | 16.7 | 2-2 | 100.0 | 9 |
| Jan 23 | at Ashland | L, 81-58 | 1 | 29 | 2-9 | 22.2 | 2-4 | 50.0 | 0-0 | - | 6 |
| Jan 25 | at Wayne St. (Mich.) | L, 68-59 | 1 | 32 | 3-6 | 50.0 | 2-4 | 50.0 | 1-4 | 25.0 | 9 |
| Jan 30 | Michigan Tech | W, 62-50 | 1 | 34 | 5-14 | 35.7 | 2-7 | 28.6 | 2-4 | 50.0 | 14 |
| Feb 1 | Northern Mich. | W, 48-40 | 1 | 34 | 2-6 | 33.3 | 1-2 | 50.0 | 0-0 | - | 5 |
| Feb 6 | at Lake Superior St. | W, 58-45 | 1 | 36 | 5-10 | 50.0 | 4-6 | 66.7 | 0-0 | - | 14 |
| Feb 8 | at Ferris St. | L, 67-66 | 1 | 29 | 5-12 | 41.7 | 2-6 | 33.3 | 0-0 | - | 12 |
| Feb 13 | at Davenport | W, 75-70 | 1 | 30 | 3-9 | 33.3 | 1-6 | 16.7 | 1-2 | 50.0 | 8 |
| Feb 15 | Grand Valley St. | L, 67-51 | 1 | 30 | 3-10 | 30.0 | 2-5 | 40.0 | 1-2 | 50.0 | 9 |
| Feb 20 | Wayne St. (Mich.) | W, 58-49 | 1 | 25 | 1-6 | 16.7 | 0-4 | 0.0 | 5-6 | 83.3 | 7 |
| Feb 22 | #2 Ashland | L, 77-56 | 1 | 35 | 6-13 | 46.2 | 2-7 | 28.6 | 0-1 | 0.0 | 14 |
| Feb 27 | at Saginaw Valley | W, 68-57 | 1 | 37 | 1-8 | 12.5 | 1-4 | 25.0 | 0-0 | - | 3 |
Game Log - Ball control
| Date | Opponent | Score | gs | min | off | def | reb | ast | to | a/to | stl | blk | pf | dq |
|---|---|---|---|---|---|---|---|---|---|---|---|---|---|---|
| Oct 30 | at Michigan | L, 97-46 | - | - | - | - | - | - | - | - | - | - | - | - |
| Nov 8 | at Findlay | L, 71-61 | - | - | - | - | - | - | - | - | - | - | - | - |
| Nov 10 | at Hillsdale | L, 80-71 | - | - | - | - | - | - | - | - | - | - | - | - |
| Nov 16 | Lewis | L, 72-64 | - | - | - | - | - | - | - | - | - | - | - | - |
| Nov 23 | Ursuline | W, 94-83 | - | - | - | - | - | - | - | - | - | - | - | - |
| Nov 26 | at Ohio Dominican | L, 76-66 | - | 25 | 0 | 4 | 4 | 1 | 2 | 0.5 | 1 | 0 | 1 | - |
| Nov 27 | at Cedarville | L, 84-62 | - | 20 | 0 | 0 | 0 | 1 | 2 | 0.5 | 0 | 0 | 3 | - |
| Nov 30 | Indianapolis | L, 62-58 | 1 | 31 | 2 | 4 | 6 | 2 | 2 | 1.0 | 0 | 0 | 1 | - |
| Dec 5 | at Northern Mich. | L, 55-47 | 1 | 31 | 1 | 4 | 5 | 1 | 3 | 0.3 | 0 | 0 | 1 | - |
| Dec 7 | at Michigan Tech | L, 69-46 | 1 | 29 | 0 | 2 | 2 | 0 | 1 | 0.0 | 2 | 0 | 0 | - |
| Dec 15 | Saginaw Valley | L, 58-52 | 1 | 34 | 1 | 8 | 9 | 2 | 0 | - | 0 | 1 | 3 | - |
| Dec 21 | Lawrence Tech | W, 71-52 | 1 | 28 | 1 | 4 | 5 | 1 | 3 | 0.3 | 1 | 0 | 2 | - |
| Jan 2 | Parkside | L, 65-55 | 1 | 32 | 0 | 5 | 5 | 1 | 1 | 1.0 | 0 | 1 | 1 | - |
| Jan 4 | at Purdue Northwest | L, 61-52 | 1 | 30 | 0 | 5 | 5 | 2 | 1 | 2.0 | 0 | 0 | 5 | 0 |
| Jan 9 | Ferris St. | L, 75-64 | 1 | 35 | 2 | 6 | 8 | 2 | 0 | - | 3 | 0 | 2 | - |
| Jan 11 | Lake Superior St. | W, 52-42 | 1 | 33 | 2 | 3 | 5 | 0 | 2 | 0.0 | 1 | 0 | 3 | - |
| Jan 16 | at Grand Valley St. | L, 74-35 | 1 | 20 | 0 | 5 | 5 | 0 | 3 | 0.0 | 0 | 0 | 1 | - |
| Jan 18 | Davenport | W, 64-39 | 1 | 29 | 1 | 3 | 4 | 2 | 2 | 1.0 | 1 | 0 | 0 | - |
| Jan 23 | at Ashland | L, 81-58 | 1 | 29 | 1 | 7 | 8 | 2 | 4 | 0.5 | 3 | 0 | 0 | - |
| Jan 25 | at Wayne St. (Mich.) | L, 68-59 | 1 | 32 | 1 | 7 | 8 | 1 | 1 | 1.0 | 0 | 0 | 5 | 1 |
| Jan 30 | Michigan Tech | W, 62-50 | 1 | 34 | 4 | 4 | 8 | 2 | 3 | 0.7 | 1 | 0 | 3 | - |
| Feb 1 | Northern Mich. | W, 48-40 | 1 | 34 | 0 | 5 | 5 | 3 | 1 | 3.0 | 1 | 1 | 0 | - |
| Feb 6 | at Lake Superior St. | W, 58-45 | 1 | 36 | 0 | 3 | 3 | 1 | 1 | 1.0 | 1 | 0 | 0 | - |
| Feb 8 | at Ferris St. | L, 67-66 | 1 | 29 | 1 | 4 | 5 | 3 | 2 | 1.5 | 2 | 0 | 2 | - |
| Feb 13 | at Davenport | W, 75-70 | 1 | 30 | 3 | 4 | 7 | 1 | 1 | 1.0 | 3 | 0 | 1 | - |
| Feb 15 | Grand Valley St. | L, 67-51 | 1 | 30 | 0 | 3 | 3 | 3 | 0 | - | 0 | 0 | 3 | - |
| Feb 20 | Wayne St. (Mich.) | W, 58-49 | 1 | 25 | 1 | 2 | 3 | 3 | 0 | - | 2 | 1 | 3 | - |
| Feb 22 | #2 Ashland | L, 77-56 | 1 | 35 | 2 | 8 | 10 | 3 | 2 | 1.5 | 4 | 0 | 4 | - |
| Feb 27 | at Saginaw Valley | W, 68-57 | 1 | 37 | 2 | 4 | 6 | 2 | 1 | 2.0 | 0 | 1 | 0 | - |
Career Stats - Shooting per game
| gp | gs | min/g | fg/g | pct | 3pt/g | pct | ft/g | pct | ppg | |
|---|---|---|---|---|---|---|---|---|---|---|
| 2018-19 | 29 | 28 | 32.1 | 4.1-10.7 | 38.8 | 2.1-5.6 | 37.4 | 2.3-2.9 | 79.5 | 12.7 |
| 2019-20 | 24 | 22 | 30.3 | 3.9-10.3 | 37.5 | 1.8-5.2 | 35.5 | 1.4-1.9 | 71.7 | 11.0 |
| 2020-21 | 15 | 11 | 21.9 | 2.3-7.0 | 33.3 | 0.9-3.5 | 26.9 | 0.7-1.1 | 64.7 | 6.3 |
| 2021-22 | 28 | 28 | 30.6 | 4.1-9.6 | 43.1 | 1.6-4.4 | 36.1 | 3.0-3.7 | 79.8 | 12.8 |
| Total | 96 | 89 | 29.6 | 3.8-9.7 | 39.1 | 1.7-4.8 | 35.4 | 2.0-2.6 | 77.2 | 11.3 |
Career Stats - Shooting totals
| gp | gs | min | fg | pct | 3pt | pct | ft | pct | pts | |
|---|---|---|---|---|---|---|---|---|---|---|
| 2018-19 | 29 | 28 | 931 | 120-309 | 38.8 | 61-163 | 37.4 | 66-83 | 79.5 | 367 |
| 2019-20 | 24 | 22 | 728 | 93-248 | 37.5 | 44-124 | 35.5 | 33-46 | 71.7 | 263 |
| 2020-21 | 15 | 11 | 329 | 35-105 | 33.3 | 14-52 | 26.9 | 11-17 | 64.7 | 95 |
| 2021-22 | 28 | 28 | 857 | 116-269 | 43.1 | 44-122 | 36.1 | 83-104 | 79.8 | 359 |
| Total | 96 | 89 | 2845 | 364-931 | 39.1 | 163-461 | 35.4 | 193-250 | 77.2 | 1084 |
Career Stats - Shooting per 40 min
| gp | gs | min/g | fg/40 | pct | 3pt/40 | pct | ft/40 | pct | pts/40 | |
|---|---|---|---|---|---|---|---|---|---|---|
| 2018-19 | 29 | 28 | 32.1 | 5.2-13.3 | 38.8 | 2.6-7.0 | 37.4 | 2.8-3.6 | 79.5 | 15.8 |
| 2019-20 | 24 | 22 | 30.3 | 5.1-13.6 | 37.5 | 2.4-6.8 | 35.5 | 1.8-2.5 | 71.7 | 14.5 |
| 2020-21 | 15 | 11 | 21.9 | 4.3-12.8 | 33.3 | 1.7-6.3 | 26.9 | 1.3-2.1 | 64.7 | 11.6 |
| 2021-22 | 28 | 28 | 30.6 | 5.4-12.6 | 43.1 | 2.1-5.7 | 36.1 | 3.9-4.9 | 79.8 | 16.8 |
| Total | 96 | 89 | 29.6 | 5.1-13.1 | 39.1 | 2.3-6.5 | 35.4 | 2.7-3.5 | 77.2 | 15.2 |
Career Stats - Ball control per game
| gp | gs | mpg | off/g | def/g | reb/g | pf/g | dq/g | ast/g | to/g | a/to | stl/g | blk/g | |
|---|---|---|---|---|---|---|---|---|---|---|---|---|---|
| 2018-19 | 29 | 28 | 32.1 | 0.7 | 4.1 | 4.8 | 2.2 | 0.1 | 2.0 | 1.6 | 1.2 | 1.6 | 0.2 |
| 2019-20 | 24 | 22 | 30.3 | 1.0 | 4.3 | 5.4 | 1.8 | 0.0 | 1.6 | 1.6 | 1.0 | 1.1 | 0.2 |
| 2020-21 | 15 | 11 | 21.9 | 0.7 | 2.3 | 2.9 | 1.7 | - | 0.9 | 1.0 | 0.9 | 0.9 | 0.2 |
| 2021-22 | 28 | 28 | 30.6 | 1.4 | 3.4 | 4.8 | 1.9 | 0.0 | 2.9 | 1.6 | 1.8 | 1.1 | 0.1 |
| Total | 96 | 89 | 29.6 | 1.0 | 3.7 | 4.7 | 1.9 | 0.0 | 2.0 | 1.5 | 1.3 | 1.2 | 0.2 |
Career Stats - Ball control totals
Career Stats - Ball control per 40 min
| gp | gs | mpg | off/40 | def/40 | reb/40 | pf/40 | dq/40 | ast/40 | to/40 | a/to | stl/40 | blk/40 | |
|---|---|---|---|---|---|---|---|---|---|---|---|---|---|
| 2018-19 | 29 | 28 | 32.1 | 0.9 | 5.1 | 6.0 | 2.8 | 0.1 | 2.4 | 2.0 | 1.2 | 2.0 | 0.3 |
| 2019-20 | 24 | 22 | 30.3 | 1.4 | 5.7 | 7.1 | 2.4 | 0.1 | 2.1 | 2.1 | 1.0 | 1.4 | 0.3 |
| 2020-21 | 15 | 11 | 21.9 | 1.2 | 4.1 | 5.3 | 3.0 | 0.0 | 1.6 | 1.8 | 0.9 | 1.7 | 0.4 |
| 2021-22 | 28 | 28 | 30.6 | 1.9 | 4.4 | 6.3 | 2.4 | 0.0 | 3.8 | 2.1 | 1.8 | 1.4 | 0.1 |
| Total | 96 | 89 | 29.6 | 1.3 | 4.9 | 6.3 | 2.6 | 0.0 | 2.7 | 2.0 | 1.3 | 1.7 | 0.2 |
Splits Stats - Shooting per game
| gp | gs | min/g | fg/g | pct | 3pt/g | pct | ft/g | pct | ppg | ||
|---|---|---|---|---|---|---|---|---|---|---|---|
| Event | Total | 24 | 22 | 30.3 | 3.9-10.3 | 37.5 | 1.8-5.2 | 35.5 | 1.4-1.9 | 71.7 | 11.0 |
| Conference | 20 | 20 | 31.2 | 3.5-10.1 | 35.3 | 1.6-5.0 | 33.3 | 1.4-1.9 | 71.1 | 10.1 | |
| Exhibition | - | - | - | 0.0-0.0 | - | 0.0-0.0 | - | 0.0-0.0 | - | - | |
| Location | Home | 12 | 12 | 31.7 | 4.5-12.1 | 37.2 | 2.1-5.9 | 35.2 | 1.8-2.5 | 70.0 | 12.8 |
| Away | 12 | 10 | 29.0 | 3.2-8.6 | 37.9 | 1.6-4.4 | 35.8 | 1.0-1.3 | 75.0 | 9.1 | |
| Neutral | - | - | - | 0.0-0.0 | - | 0.0-0.0 | - | 0.0-0.0 | - | - | |
| Result | Wins | 9 | 9 | 31.8 | 3.2-9.7 | 33.3 | 1.7-5.2 | 31.9 | 1.8-2.4 | 72.7 | 9.9 |
| Losses | 15 | 13 | 29.5 | 4.3-10.7 | 39.8 | 1.9-5.1 | 37.7 | 1.1-1.6 | 70.8 | 11.6 | |
| Month | November | 3 | 1 | 25.3 | 5.0-11.7 | 42.9 | 2.3-6.0 | 38.9 | 0.7-0.7 | 100.0 | 13.0 |
| December | 4 | 4 | 30.5 | 6.0-12.2 | 49.0 | 2.2-5.2 | 42.9 | 3.8-4.5 | 83.3 | 18.0 | |
| January | 9 | 9 | 30.4 | 3.1-10.0 | 31.1 | 1.7-5.0 | 33.3 | 1.0-1.7 | 60.0 | 8.9 | |
| February | 8 | 8 | 32.0 | 3.2-9.2 | 35.1 | 1.6-5.0 | 32.5 | 0.9-1.4 | 63.6 | 9.0 |
Splits Stats - Shooting totals
| gp | gs | min | fg | pct | 3pt | pct | ft | pct | pts | ||
|---|---|---|---|---|---|---|---|---|---|---|---|
| Event | Total | 24 | 22 | 728 | 93-248 | 37.5 | 44-124 | 35.5 | 33-46 | 71.7 | 263 |
| Conference | 20 | 20 | 624 | 71-201 | 35.3 | 33-99 | 33.3 | 27-38 | 71.1 | 202 | |
| Exhibition | - | - | - | 0-0 | - | 0-0 | - | 0-0 | - | 0 | |
| Location | Home | 12 | 12 | 380 | 54-145 | 37.2 | 25-71 | 35.2 | 21-30 | 70.0 | 154 |
| Away | 12 | 10 | 348 | 39-103 | 37.9 | 19-53 | 35.8 | 12-16 | 75.0 | 109 | |
| Neutral | - | - | - | 0-0 | - | 0-0 | - | 0-0 | - | 0 | |
| Result | Wins | 9 | 9 | 286 | 29-87 | 33.3 | 15-47 | 31.9 | 16-22 | 72.7 | 89 |
| Losses | 15 | 13 | 442 | 64-161 | 39.8 | 29-77 | 37.7 | 17-24 | 70.8 | 174 | |
| Month | November | 3 | 1 | 76 | 15-35 | 42.9 | 7-18 | 38.9 | 2-2 | 100.0 | 39 |
| December | 4 | 4 | 122 | 24-49 | 49.0 | 9-21 | 42.9 | 15-18 | 83.3 | 72 | |
| January | 9 | 9 | 274 | 28-90 | 31.1 | 15-45 | 33.3 | 9-15 | 60.0 | 80 | |
| February | 8 | 8 | 256 | 26-74 | 35.1 | 13-40 | 32.5 | 7-11 | 63.6 | 72 |
Splits Stats - Shooting per 40 min
| gp | gs | min/g | fg/40 | pct | 3pt/40 | pct | ft/40 | pct | pts/40 | ||
|---|---|---|---|---|---|---|---|---|---|---|---|
| Event | Total | 24 | 22 | 30.3 | 5.1-13.6 | 37.5 | 2.4-6.8 | 35.5 | 1.8-2.5 | 71.7 | 14.5 |
| Conference | 20 | 20 | 31.2 | 4.6-12.9 | 35.3 | 2.1-6.3 | 33.3 | 1.7-2.4 | 71.1 | 12.9 | |
| Exhibition | - | - | - | 0.0-0.0 | - | 0.0-0.0 | - | 0.0-0.0 | - | - | |
| Location | Home | 12 | 12 | 31.7 | 5.7-15.3 | 37.2 | 2.6-7.5 | 35.2 | 2.2-3.2 | 70.0 | 16.2 |
| Away | 12 | 10 | 29.0 | 4.5-11.8 | 37.9 | 2.2-6.1 | 35.8 | 1.4-1.8 | 75.0 | 12.5 | |
| Neutral | - | - | - | 0.0-0.0 | - | 0.0-0.0 | - | 0.0-0.0 | - | - | |
| Result | Wins | 9 | 9 | 31.8 | 4.1-12.2 | 33.3 | 2.1-6.6 | 31.9 | 2.2-3.1 | 72.7 | 12.4 |
| Losses | 15 | 13 | 29.5 | 5.8-14.6 | 39.8 | 2.6-7.0 | 37.7 | 1.5-2.2 | 70.8 | 15.7 | |
| Month | November | 3 | 1 | 25.3 | 7.9-18.4 | 42.9 | 3.7-9.5 | 38.9 | 1.1-1.1 | 100.0 | 20.5 |
| December | 4 | 4 | 30.5 | 7.9-16.1 | 49.0 | 3.0-6.9 | 42.9 | 4.9-5.9 | 83.3 | 23.6 | |
| January | 9 | 9 | 30.4 | 4.1-13.1 | 31.1 | 2.2-6.6 | 33.3 | 1.3-2.2 | 60.0 | 11.7 | |
| February | 8 | 8 | 32.0 | 4.1-11.6 | 35.1 | 2.0-6.2 | 32.5 | 1.1-1.7 | 63.6 | 11.3 |
Splits Stats - Ball control per game
| gp | gs | mpg | off/g | def/g | reb/g | pf/g | dq/g | ast/g | to/g | a/to | stl/g | blk/g | ||
|---|---|---|---|---|---|---|---|---|---|---|---|---|---|---|
| Event | Total | 24 | 22 | 30.3 | 1.0 | 4.3 | 5.4 | 1.8 | 0.0 | 1.6 | 1.6 | 1.0 | 1.1 | 0.2 |
| Conference | 20 | 20 | 31.2 | 1.1 | 4.6 | 5.7 | 1.9 | 0.1 | 1.7 | 1.4 | 1.2 | 1.2 | 0.3 | |
| Exhibition | - | - | - | - | - | - | - | - | - | - | - | - | - | |
| Location | Home | 12 | 12 | 31.7 | 1.3 | 4.6 | 5.9 | 2.1 | - | 2.0 | 1.3 | 1.5 | 1.2 | 0.3 |
| Away | 12 | 10 | 29.0 | 0.8 | 4.1 | 4.8 | 1.6 | 0.1 | 1.3 | 1.8 | 0.7 | 1.0 | 0.1 | |
| Neutral | - | - | - | - | - | - | - | - | - | - | - | - | - | |
| Result | Wins | 9 | 9 | 31.8 | 1.6 | 3.6 | 5.1 | 1.3 | - | 1.7 | 1.6 | 1.1 | 1.2 | 0.3 |
| Losses | 15 | 13 | 29.5 | 0.7 | 4.8 | 5.5 | 2.1 | 0.1 | 1.6 | 1.6 | 1.0 | 1.0 | 0.1 | |
| Month | November | 3 | 1 | 25.3 | 0.7 | 2.7 | 3.3 | 1.7 | - | 1.3 | 2.0 | 0.7 | 0.3 | 0.0 |
| December | 4 | 4 | 30.5 | 0.8 | 4.5 | 5.3 | 1.5 | - | 1.0 | 1.8 | 0.6 | 0.8 | 0.3 | |
| January | 9 | 9 | 30.4 | 1.2 | 5.0 | 6.2 | 2.2 | 0.1 | 1.3 | 1.9 | 0.7 | 1.0 | 0.1 | |
| February | 8 | 8 | 32.0 | 1.1 | 4.1 | 5.3 | 1.6 | - | 2.4 | 1.0 | 2.4 | 1.6 | 0.4 |
Splits Stats - Ball control totals
| gp | gs | min | off | def | reb | pf | dq | ast | to | a/to | stl | blk | ||
|---|---|---|---|---|---|---|---|---|---|---|---|---|---|---|
| Event | Total | 24 | 22 | 728 | 25 | 104 | 129 | 44 | 1 | 39 | 38 | 1.0 | 26 | 5 |
| Conference | 20 | 20 | 624 | 22 | 92 | 114 | 37 | 1 | 34 | 29 | 1.2 | 24 | 5 | |
| Exhibition | - | - | - | - | - | - | - | - | - | - | - | - | - | |
| Location | Home | 12 | 12 | 380 | 16 | 55 | 71 | 25 | - | 24 | 16 | 1.5 | 14 | 4 |
| Away | 12 | 10 | 348 | 9 | 49 | 58 | 19 | 1 | 15 | 22 | 0.7 | 12 | 1 | |
| Neutral | - | - | - | - | - | - | - | - | - | - | - | - | - | |
| Result | Wins | 9 | 9 | 286 | 14 | 32 | 46 | 12 | - | 15 | 14 | 1.1 | 11 | 3 |
| Losses | 15 | 13 | 442 | 11 | 72 | 83 | 32 | 1 | 24 | 24 | 1.0 | 15 | 2 | |
| Month | November | 3 | 1 | 76 | 2 | 8 | 10 | 5 | - | 4 | 6 | 0.7 | 1 | 0 |
| December | 4 | 4 | 122 | 3 | 18 | 21 | 6 | - | 4 | 7 | 0.6 | 3 | 1 | |
| January | 9 | 9 | 274 | 11 | 45 | 56 | 20 | 1 | 12 | 17 | 0.7 | 9 | 1 | |
| February | 8 | 8 | 256 | 9 | 33 | 42 | 13 | - | 19 | 8 | 2.4 | 13 | 3 |
Splits Stats - Ball control per 40 min
| gp | gs | mpg | off/40 | def/40 | reb/40 | pf/40 | dq/40 | ast/40 | to/40 | a/to | stl/40 | blk/40 | ||
|---|---|---|---|---|---|---|---|---|---|---|---|---|---|---|
| Event | Total | 24 | 22 | 30.3 | 1.4 | 5.7 | 7.1 | 2.4 | 0.1 | 2.1 | 2.1 | 1.0 | 1.4 | 0.3 |
| Conference | 20 | 20 | 31.2 | 1.4 | 5.9 | 7.3 | 2.4 | 0.1 | 2.2 | 1.9 | 1.2 | 1.5 | 0.3 | |
| Exhibition | - | - | - | - | - | - | - | - | - | - | - | - | - | |
| Location | Home | 12 | 12 | 31.7 | 1.7 | 5.8 | 7.5 | 2.6 | 0.0 | 2.5 | 1.7 | 1.5 | 1.5 | 0.4 |
| Away | 12 | 10 | 29.0 | 1.0 | 5.6 | 6.7 | 2.2 | 0.1 | 1.7 | 2.5 | 0.7 | 1.4 | 0.1 | |
| Neutral | - | - | - | - | - | - | - | - | - | - | - | - | - | |
| Result | Wins | 9 | 9 | 31.8 | 2.0 | 4.5 | 6.4 | 1.7 | 0.0 | 2.1 | 2.0 | 1.1 | 1.5 | 0.4 |
| Losses | 15 | 13 | 29.5 | 1.0 | 6.5 | 7.5 | 2.9 | 0.1 | 2.2 | 2.2 | 1.0 | 1.4 | 0.2 | |
| Month | November | 3 | 1 | 25.3 | 1.1 | 4.2 | 5.3 | 2.6 | 0.0 | 2.1 | 3.2 | 0.7 | 0.5 | 0.0 |
| December | 4 | 4 | 30.5 | 1.0 | 5.9 | 6.9 | 2.0 | 0.0 | 1.3 | 2.3 | 0.6 | 1.0 | 0.3 | |
| January | 9 | 9 | 30.4 | 1.6 | 6.6 | 8.2 | 2.9 | 0.1 | 1.8 | 2.5 | 0.7 | 1.3 | 0.1 | |
| February | 8 | 8 | 32.0 | 1.4 | 5.2 | 6.6 | 2.0 | 0.0 | 3.0 | 1.3 | 2.4 | 2.0 | 0.5 |
News Mentions

Women's Basketball Loses To #2 Ashland 77-56
February 22, 2020

Women's Basketball Drops Tough 67-66 Contest At Ferris State
February 8, 2020


Women's Basketball Defeats Michigan Tech 62-50
January 30, 2020

Women's Basketball Falls At Wayne State 68-59
January 25, 2020

Women's Basketball Defeats Davenport 64-39
January 18, 2020

Women's Basketball Falls To Ferris State 75-64
January 9, 2020

Women's Basketball Loses To Parkside 65-55
January 2, 2020

Women's Basketball Downs Lawrence Tech 71-52
December 21, 2019

Women's Basketball Drops 58-52 Game To Saginaw Valley
December 15, 2019

Women's Basketball Drops 69-46 Contest At Michigan Tech
December 7, 2019

Women's Basketball Loses At Northern Michigan 55-47
December 5, 2019
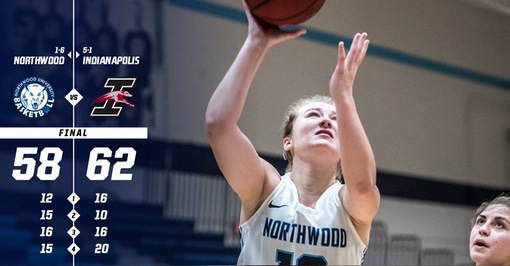
Women's Basketball Drops 62-58 Contest To Indianapolis
November 30, 2019

Women's Basketball Falls At Ohio Dominican 76-66
November 26, 2019

Photos


