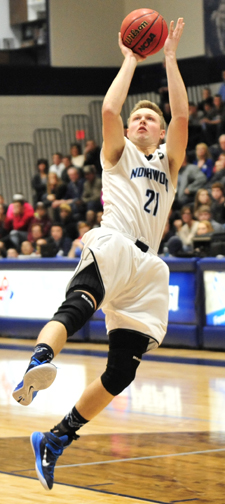
21 Zach Allread

-
- Height:
- 6-6
-
- Weight:
- 218
-
- Year:
- Jr.
-
- Hometown:
- West Bloomfield, Mich.
-
- High School:
- West Bloomfield
-
- Position:
- F
-
- gp
- 28
-
- pts/g
- 10.1
-
- fg %
- 47.8
-
- 3pt %
- 37.4
-
- ft %
- 78.7
-
- reb/g
- 5.1
-
- a/g
- 1.0
Bio
|
High School/Personal
|
|
Player Profile
| Overall | Conf | |||
|---|---|---|---|---|
| Games | 28 | 20 | ||
| Games started | 28 | 20 | ||
| Minutes | 696 | 532 | ||
| Minutes per game | 24.9 | 26.6 | ||
| FG | 89-186 | 67-144 | ||
| FG Pct | 47.8 | 46.5 | ||
| 3PT | 34-91 | 23-67 | ||
| 3PT Pct | 37.4 | 34.3 | ||
| FT | 70-89 | 56-74 | ||
| FT Pct | 78.7 | 75.7 | ||
| Off rebounds | 37 | 31 | ||
| Def rebounds | 105 | 81 | ||
| Total rebounds | 142 | 112 | ||
| Rebounds per game | 5.1 | 5.6 | ||
| Personal fouls | 56 | 40 | ||
| Disqualifications | - | - | ||
| Assists | 28 | 21 | ||
| Turnovers | 41 | 29 | ||
| Assist to turnover ratio | 0.7 | 0.7 | ||
| Steals | 17 | 15 | ||
| Blocks | 4 | 2 | ||
| Points | 282 | 213 | ||
| Points per game | 10.1 | 10.7 | ||
| Points per 40 min | 16.2 | 16.0 | ||
Game Log - Shooting
| Date | Opponent | Score | gs | min | fg | pct | 3pt | pct | ft | pct | pts |
|---|---|---|---|---|---|---|---|---|---|---|---|
| Oct 30 | at Alma | W, 92-63 | 1 | 16 | 1-4 | 25.0 | 1-4 | 25.0 | 0-0 | - | 3 |
| Nov 5 | at Central Mich. | L, 81-71 | 1 | 22 | 3-7 | 42.9 | 0-2 | 0.0 | 0-0 | - | 6 |
| Nov 7 | at Nebraska | L, 80-62 | 1 | 21 | 1-4 | 25.0 | 1-2 | 50.0 | 1-2 | 50.0 | 4 |
| Nov 10 | at Indianapolis | W, 73-71 | 1 | 18 | 3-6 | 50.0 | 1-3 | 33.3 | 0-1 | 0.0 | 7 |
| Nov 11 | vs. Bellarmine | L, 80-70 | 1 | 16 | 2-6 | 33.3 | 1-4 | 25.0 | 0-0 | - | 5 |
| Nov 18 | at Walsh | W, 88-85 | 1 | 20 | 1-2 | 50.0 | 0-1 | 0.0 | 2-2 | 100.0 | 4 |
| Nov 20 | at Cedarville | L, 61-57 | 1 | 15 | 2-3 | 66.7 | 1-2 | 50.0 | 2-2 | 100.0 | 7 |
| Nov 25 | at Western Mich. | L, 88-59 | - | 13 | 1-5 | 20.0 | 0-3 | 0.0 | 1-2 | 50.0 | 3 |
| Nov 27 | Findlay | L, 84-74 | 1 | 27 | 4-7 | 57.1 | 1-3 | 33.3 | 0-0 | - | 9 |
| Nov 30 | at Northern Mich. | L, 82-71 | 1 | 28 | 1-8 | 12.5 | 1-3 | 33.3 | 2-4 | 50.0 | 5 |
| Dec 2 | at Michigan Tech | L, 87-70 | 1 | 23 | 3-4 | 75.0 | 1-2 | 50.0 | 3-4 | 75.0 | 10 |
| Dec 7 | Ferris St. | L, 76-65 | 1 | 16 | 2-4 | 50.0 | 1-3 | 33.3 | 2-2 | 100.0 | 7 |
| Dec 9 | Lake Superior St. | L, 92-76 | 1 | 22 | 2-3 | 66.7 | 0-1 | 0.0 | 1-2 | 50.0 | 5 |
| Dec 16 | Saginaw Valley | L, 64-53 | 1 | 19 | 4-7 | 57.1 | 2-3 | 66.7 | 3-3 | 100.0 | 13 |
| Dec 19 | Wis.-Parkside | W, 81-68 | 1 | 28 | 3-6 | 50.0 | 2-2 | 100.0 | 10-10 | 100.0 | 18 |
| Dec 30 | Lewis | L, 89-72 | 1 | 24 | 5-8 | 62.5 | 4-7 | 57.1 | 0-0 | - | 14 |
| Jan 4 | Grand Valley St. | L, 88-80 | 1 | 23 | 1-4 | 25.0 | 0-1 | 0.0 | 3-4 | 75.0 | 5 |
| Jan 6 | at Purdue Northwest | L, 55-52 | 1 | 16 | 3-5 | 60.0 | 1-2 | 50.0 | 5-5 | 100.0 | 12 |
| Jan 11 | at Davenport | W, 57-52 | 1 | 29 | 2-9 | 22.2 | 0-5 | 0.0 | 0-2 | 0.0 | 4 |
| Jan 13 | Wayne St. (Mich.) | W, 73-71 | 1 | 25 | 1-2 | 50.0 | 0-0 | - | 2-2 | 100.0 | 4 |
| Jan 18 | Tiffin | W, 92-81 | 1 | 32 | 5-11 | 45.5 | 1-3 | 33.3 | 6-6 | 100.0 | 17 |
| Jan 20 | Ashland | W, 74-64 | 1 | 28 | 5-12 | 41.7 | 2-7 | 28.6 | 1-1 | 100.0 | 13 |
| Jan 24 | Grace Bible (Mich.) | W, 88-65 | 1 | 16 | 2-4 | 50.0 | 1-2 | 50.0 | 0-0 | - | 5 |
| Jan 27 | at Saginaw Valley | W, 68-64 | 1 | 30 | 6-9 | 66.7 | 1-2 | 50.0 | 4-8 | 50.0 | 17 |
| Feb 1 | at Ferris St. | L, 88-60 | 1 | 32 | 2-7 | 28.6 | 1-4 | 25.0 | 0-0 | - | 5 |
| Feb 3 | at Lake Superior St. | L, 82-61 | 1 | 24 | 2-5 | 40.0 | 2-4 | 50.0 | 2-2 | 100.0 | 8 |
| Feb 8 | Northern Mich. | L, 80-72 | 1 | 30 | 5-8 | 62.5 | 3-5 | 60.0 | 1-2 | 50.0 | 14 |
| Feb 10 | Michigan Tech | L, 75-70 | 1 | 24 | 1-5 | 20.0 | 0-2 | 0.0 | 4-4 | 100.0 | 6 |
| Feb 15 | Davenport | W, 74-72 | 1 | 33 | 2-7 | 28.6 | 0-4 | 0.0 | 5-9 | 55.6 | 9 |
| Feb 17 | at Wayne St. (Mich.) | L, 87-73 | 1 | 28 | 6-11 | 54.5 | 1-5 | 20.0 | 4-4 | 100.0 | 17 |
| Feb 22 | at Tiffin | W, 85-75 | 1 | 42 | 8-13 | 61.5 | 3-4 | 75.0 | 8-10 | 80.0 | 27 |
| Feb 24 | at Ashland | L, 81-57 | 1 | 28 | 6-10 | 60.0 | 3-7 | 42.9 | 0-0 | - | 15 |
Game Log - Ball control
| Date | Opponent | Score | gs | min | off | def | reb | ast | to | a/to | stl | blk | pf | dq |
|---|---|---|---|---|---|---|---|---|---|---|---|---|---|---|
| Oct 30 | at Alma | W, 92-63 | 1 | 16 | 0 | 4 | 4 | 2 | 1 | 2.0 | 0 | 0 | 1 | - |
| Nov 5 | at Central Mich. | L, 81-71 | 1 | 22 | 2 | 1 | 3 | 1 | 3 | 0.3 | 0 | 0 | 3 | - |
| Nov 7 | at Nebraska | L, 80-62 | 1 | 21 | 0 | 2 | 2 | 0 | 3 | 0.0 | 0 | 0 | 1 | - |
| Nov 10 | at Indianapolis | W, 73-71 | 1 | 18 | 1 | 1 | 2 | 0 | 2 | 0.0 | 1 | 0 | 4 | - |
| Nov 11 | vs. Bellarmine | L, 80-70 | 1 | 16 | 1 | 0 | 1 | 0 | 2 | 0.0 | 0 | 0 | 1 | - |
| Nov 18 | at Walsh | W, 88-85 | 1 | 20 | 0 | 2 | 2 | 0 | 1 | 0.0 | 0 | 0 | 0 | - |
| Nov 20 | at Cedarville | L, 61-57 | 1 | 15 | 0 | 1 | 1 | 1 | 3 | 0.3 | 0 | 0 | 1 | - |
| Nov 25 | at Western Mich. | L, 88-59 | - | 13 | 0 | 3 | 3 | 1 | 1 | 1.0 | 0 | 0 | 1 | - |
| Nov 27 | Findlay | L, 84-74 | 1 | 27 | 0 | 9 | 9 | 3 | 2 | 1.5 | 0 | 1 | 3 | - |
| Nov 30 | at Northern Mich. | L, 82-71 | 1 | 28 | 5 | 3 | 8 | 2 | 1 | 2.0 | 1 | 0 | 2 | - |
| Dec 2 | at Michigan Tech | L, 87-70 | 1 | 23 | 1 | 7 | 8 | 1 | 0 | - | 0 | 0 | 3 | - |
| Dec 7 | Ferris St. | L, 76-65 | 1 | 16 | 0 | 7 | 7 | 0 | 1 | 0.0 | 0 | 0 | 3 | - |
| Dec 9 | Lake Superior St. | L, 92-76 | 1 | 22 | 1 | 2 | 3 | 6 | 0 | - | 1 | 1 | 1 | - |
| Dec 16 | Saginaw Valley | L, 64-53 | 1 | 19 | 0 | 1 | 1 | 1 | 2 | 0.5 | 0 | 0 | 3 | - |
| Dec 19 | Wis.-Parkside | W, 81-68 | 1 | 28 | 2 | 6 | 8 | 0 | 2 | 0.0 | 1 | 0 | 1 | - |
| Dec 30 | Lewis | L, 89-72 | 1 | 24 | 0 | 4 | 4 | 3 | 0 | - | 0 | 0 | 4 | - |
| Jan 4 | Grand Valley St. | L, 88-80 | 1 | 23 | 1 | 2 | 3 | 0 | 0 | - | 0 | 0 | 3 | - |
| Jan 6 | at Purdue Northwest | L, 55-52 | 1 | 16 | 2 | 4 | 6 | 0 | 4 | 0.0 | 0 | 0 | 2 | - |
| Jan 11 | at Davenport | W, 57-52 | 1 | 29 | 2 | 7 | 9 | 1 | 1 | 1.0 | 3 | 0 | 3 | - |
| Jan 13 | Wayne St. (Mich.) | W, 73-71 | 1 | 25 | 0 | 4 | 4 | 1 | 3 | 0.3 | 0 | 0 | 4 | - |
| Jan 18 | Tiffin | W, 92-81 | 1 | 32 | 3 | 5 | 8 | 1 | 0 | - | 1 | 0 | 1 | - |
| Jan 20 | Ashland | W, 74-64 | 1 | 28 | 0 | 3 | 3 | 0 | 0 | - | 0 | 0 | 0 | - |
| Jan 24 | Grace Bible (Mich.) | W, 88-65 | 1 | 16 | 2 | 1 | 3 | 0 | 0 | - | 0 | 1 | 2 | - |
| Jan 27 | at Saginaw Valley | W, 68-64 | 1 | 30 | 2 | 4 | 6 | 0 | 1 | 0.0 | 1 | 0 | 2 | - |
| Feb 1 | at Ferris St. | L, 88-60 | 1 | 32 | 0 | 5 | 5 | 1 | 3 | 0.3 | 1 | 0 | 2 | - |
| Feb 3 | at Lake Superior St. | L, 82-61 | 1 | 24 | 0 | 2 | 2 | 0 | 2 | 0.0 | 0 | 0 | 2 | - |
| Feb 8 | Northern Mich. | L, 80-72 | 1 | 30 | 2 | 3 | 5 | 1 | 1 | 1.0 | 0 | 0 | 3 | - |
| Feb 10 | Michigan Tech | L, 75-70 | 1 | 24 | 3 | 2 | 5 | 2 | 1 | 2.0 | 1 | 0 | 1 | - |
| Feb 15 | Davenport | W, 74-72 | 1 | 33 | 4 | 5 | 9 | 0 | 0 | - | 0 | 0 | 1 | - |
| Feb 17 | at Wayne St. (Mich.) | L, 87-73 | 1 | 28 | 1 | 3 | 4 | 1 | 1 | 1.0 | 1 | 1 | 1 | - |
| Feb 22 | at Tiffin | W, 85-75 | 1 | 42 | 2 | 11 | 13 | 2 | 4 | 0.5 | 2 | 0 | 3 | - |
| Feb 24 | at Ashland | L, 81-57 | 1 | 28 | 2 | 1 | 3 | 1 | 4 | 0.3 | 3 | 0 | 0 | - |
Career Stats - Shooting per game
| gp | gs | min/g | fg/g | pct | 3pt/g | pct | ft/g | pct | ppg | |
|---|---|---|---|---|---|---|---|---|---|---|
| 2015-16 | 28 | - | 13.4 | 2.4-4.8 | 50.0 | 0.8-2.0 | 40.0 | 1.4-1.8 | 81.6 | 7.0 |
| 2016-17 | 30 | 29 | 24.6 | 2.5-6.6 | 38.1 | 1.2-3.2 | 37.9 | 2.2-3.1 | 72.8 | 8.4 |
| 2017-18 | 28 | 28 | 24.9 | 3.2-6.6 | 47.8 | 1.2-3.2 | 37.4 | 2.5-3.2 | 78.7 | 10.1 |
| 2018-19 | 19 | 19 | 23.1 | 2.2-5.3 | 40.6 | 0.8-2.2 | 39.0 | 1.7-2.3 | 72.7 | 6.8 |
| Total | 105 | 76 | 21.4 | 2.6-5.9 | 44.0 | 1.0-2.7 | 38.3 | 2.0-2.6 | 76.3 | 8.2 |
Career Stats - Shooting totals
| gp | gs | min | fg | pct | 3pt | pct | ft | pct | pts | |
|---|---|---|---|---|---|---|---|---|---|---|
| 2015-16 | 28 | - | 376 | 67-134 | 50.0 | 22-55 | 40.0 | 40-49 | 81.6 | 196 |
| 2016-17 | 30 | 29 | 738 | 75-197 | 38.1 | 36-95 | 37.9 | 67-92 | 72.8 | 253 |
| 2017-18 | 28 | 28 | 696 | 89-186 | 47.8 | 34-91 | 37.4 | 70-89 | 78.7 | 282 |
| 2018-19 | 19 | 19 | 438 | 41-101 | 40.6 | 16-41 | 39.0 | 32-44 | 72.7 | 130 |
| Total | 105 | 76 | 2248 | 272-618 | 44.0 | 108-282 | 38.3 | 209-274 | 76.3 | 861 |
Career Stats - Shooting per 40 min
| gp | gs | min/g | fg/40 | pct | 3pt/40 | pct | ft/40 | pct | pts/40 | |
|---|---|---|---|---|---|---|---|---|---|---|
| 2015-16 | 28 | - | 13.4 | 7.1-14.3 | 50.0 | 2.3-5.9 | 40.0 | 4.3-5.2 | 81.6 | 20.9 |
| 2016-17 | 30 | 29 | 24.6 | 4.1-10.7 | 38.1 | 2.0-5.1 | 37.9 | 3.6-5.0 | 72.8 | 13.7 |
| 2017-18 | 28 | 28 | 24.9 | 5.1-10.7 | 47.8 | 2.0-5.2 | 37.4 | 4.0-5.1 | 78.7 | 16.2 |
| 2018-19 | 19 | 19 | 23.1 | 3.7-9.2 | 40.6 | 1.5-3.7 | 39.0 | 2.9-4.0 | 72.7 | 11.9 |
| Total | 105 | 76 | 21.4 | 4.8-11.0 | 44.0 | 1.9-5.0 | 38.3 | 3.7-4.9 | 76.3 | 15.3 |
Career Stats - Ball control per game
| gp | gs | mpg | off/g | def/g | reb/g | pf/g | dq/g | ast/g | to/g | a/to | stl/g | blk/g | |
|---|---|---|---|---|---|---|---|---|---|---|---|---|---|
| 2015-16 | 28 | - | 13.4 | 0.5 | 1.4 | 1.9 | 1.5 | - | 0.7 | 0.9 | 0.8 | 0.2 | 0.1 |
| 2016-17 | 30 | 29 | 24.6 | 1.1 | 3.4 | 4.5 | 2.7 | 0.0 | 1.3 | 1.8 | 0.7 | 0.4 | 0.1 |
| 2017-18 | 28 | 28 | 24.9 | 1.3 | 3.8 | 5.1 | 2.0 | - | 1.0 | 1.5 | 0.7 | 0.6 | 0.1 |
| 2018-19 | 19 | 19 | 23.1 | 1.3 | 3.1 | 4.4 | 1.9 | 0.1 | 1.1 | 1.2 | 1.0 | 0.4 | 0.2 |
| Total | 105 | 76 | 21.4 | 1.0 | 2.9 | 4.0 | 2.1 | 0.0 | 1.0 | 1.4 | 0.7 | 0.4 | 0.1 |
Career Stats - Ball control totals
Career Stats - Ball control per 40 min
| gp | gs | mpg | off/40 | def/40 | reb/40 | pf/40 | dq/40 | ast/40 | to/40 | a/to | stl/40 | blk/40 | |
|---|---|---|---|---|---|---|---|---|---|---|---|---|---|
| 2015-16 | 28 | - | 13.4 | 1.5 | 4.3 | 5.7 | 4.6 | 0.0 | 2.0 | 2.7 | 0.8 | 0.6 | 0.3 |
| 2016-17 | 30 | 29 | 24.6 | 1.8 | 5.6 | 7.4 | 4.4 | 0.1 | 2.1 | 3.0 | 0.7 | 0.6 | 0.1 |
| 2017-18 | 28 | 28 | 24.9 | 2.1 | 6.0 | 8.2 | 3.2 | 0.0 | 1.6 | 2.4 | 0.7 | 1.0 | 0.2 |
| 2018-19 | 19 | 19 | 23.1 | 2.3 | 5.4 | 7.7 | 3.4 | 0.1 | 1.9 | 2.0 | 1.0 | 0.6 | 0.3 |
| Total | 105 | 76 | 21.4 | 1.9 | 5.5 | 7.4 | 3.9 | 0.0 | 1.9 | 2.5 | 0.7 | 0.7 | 0.2 |
Splits Stats - Shooting per game
| gp | gs | min/g | fg/g | pct | 3pt/g | pct | ft/g | pct | ppg | ||
|---|---|---|---|---|---|---|---|---|---|---|---|
| Event | Total | 28 | 28 | 24.9 | 3.2-6.6 | 47.8 | 1.2-3.2 | 37.4 | 2.5-3.2 | 78.7 | 10.1 |
| Conference | 20 | 20 | 26.6 | 3.4-7.2 | 46.5 | 1.1-3.4 | 34.3 | 2.8-3.7 | 75.7 | 10.7 | |
| Exhibition | 4 | 3 | 18.0 | 1.5-5.0 | 30.0 | 0.5-2.8 | 18.2 | 0.5-1.0 | 50.0 | 4.0 | |
| Location | Home | 14 | 14 | 24.8 | 3.0-6.3 | 47.7 | 1.2-3.1 | 39.5 | 2.7-3.2 | 84.4 | 9.9 |
| Away | 13 | 13 | 25.6 | 3.5-7.1 | 48.9 | 1.2-3.4 | 36.4 | 2.5-3.4 | 72.7 | 10.6 | |
| Neutral | 1 | 1 | 16.0 | 2.0-6.0 | 33.3 | 1.0-4.0 | 25.0 | 0.0-0.0 | - | 5.0 | |
| Result | Wins | 11 | 11 | 27.4 | 3.5-7.4 | 46.9 | 1.0-3.0 | 33.3 | 3.5-4.6 | 74.5 | 11.4 |
| Losses | 17 | 17 | 23.2 | 3.0-6.2 | 48.6 | 1.4-3.4 | 39.7 | 1.9-2.2 | 84.2 | 9.2 | |
| Month | November | 6 | 6 | 20.7 | 2.2-5.3 | 40.6 | 0.8-2.7 | 31.3 | 1.0-1.5 | 66.7 | 6.2 |
| December | 6 | 6 | 22.0 | 3.2-5.3 | 59.4 | 1.7-3.0 | 55.6 | 3.2-3.5 | 90.5 | 11.2 | |
| January | 8 | 8 | 24.9 | 3.1-7.0 | 44.6 | 0.8-2.8 | 27.3 | 2.6-3.5 | 75.0 | 9.6 | |
| February | 8 | 8 | 30.1 | 4.0-8.2 | 48.5 | 1.6-4.4 | 37.1 | 3.0-3.9 | 77.4 | 12.6 |
Splits Stats - Shooting totals
| gp | gs | min | fg | pct | 3pt | pct | ft | pct | pts | ||
|---|---|---|---|---|---|---|---|---|---|---|---|
| Event | Total | 28 | 28 | 696 | 89-186 | 47.8 | 34-91 | 37.4 | 70-89 | 78.7 | 282 |
| Conference | 20 | 20 | 532 | 67-144 | 46.5 | 23-67 | 34.3 | 56-74 | 75.7 | 213 | |
| Exhibition | 4 | 3 | 72 | 6-20 | 30.0 | 2-11 | 18.2 | 2-4 | 50.0 | 16 | |
| Location | Home | 14 | 14 | 347 | 42-88 | 47.7 | 17-43 | 39.5 | 38-45 | 84.4 | 139 |
| Away | 13 | 13 | 333 | 45-92 | 48.9 | 16-44 | 36.4 | 32-44 | 72.7 | 138 | |
| Neutral | 1 | 1 | 16 | 2-6 | 33.3 | 1-4 | 25.0 | 0-0 | - | 5 | |
| Result | Wins | 11 | 11 | 301 | 38-81 | 46.9 | 11-33 | 33.3 | 38-51 | 74.5 | 125 |
| Losses | 17 | 17 | 395 | 51-105 | 48.6 | 23-58 | 39.7 | 32-38 | 84.2 | 157 | |
| Month | November | 6 | 6 | 124 | 13-32 | 40.6 | 5-16 | 31.3 | 6-9 | 66.7 | 37 |
| December | 6 | 6 | 132 | 19-32 | 59.4 | 10-18 | 55.6 | 19-21 | 90.5 | 67 | |
| January | 8 | 8 | 199 | 25-56 | 44.6 | 6-22 | 27.3 | 21-28 | 75.0 | 77 | |
| February | 8 | 8 | 241 | 32-66 | 48.5 | 13-35 | 37.1 | 24-31 | 77.4 | 101 |
Splits Stats - Shooting per 40 min
| gp | gs | min/g | fg/40 | pct | 3pt/40 | pct | ft/40 | pct | pts/40 | ||
|---|---|---|---|---|---|---|---|---|---|---|---|
| Event | Total | 28 | 28 | 24.9 | 5.1-10.7 | 47.8 | 2.0-5.2 | 37.4 | 4.0-5.1 | 78.7 | 16.2 |
| Conference | 20 | 20 | 26.6 | 5.0-10.8 | 46.5 | 1.7-5.0 | 34.3 | 4.2-5.6 | 75.7 | 16.0 | |
| Exhibition | 4 | 3 | 18.0 | 3.3-11.1 | 30.0 | 1.1-6.1 | 18.2 | 1.1-2.2 | 50.0 | 8.9 | |
| Location | Home | 14 | 14 | 24.8 | 4.8-10.1 | 47.7 | 2.0-5.0 | 39.5 | 4.4-5.2 | 84.4 | 16.0 |
| Away | 13 | 13 | 25.6 | 5.4-11.1 | 48.9 | 1.9-5.3 | 36.4 | 3.8-5.3 | 72.7 | 16.6 | |
| Neutral | 1 | 1 | 16.0 | 5.0-15.0 | 33.3 | 2.5-10.0 | 25.0 | 0.0-0.0 | - | 12.5 | |
| Result | Wins | 11 | 11 | 27.4 | 5.0-10.8 | 46.9 | 1.5-4.4 | 33.3 | 5.0-6.8 | 74.5 | 16.6 |
| Losses | 17 | 17 | 23.2 | 5.2-10.6 | 48.6 | 2.3-5.9 | 39.7 | 3.2-3.8 | 84.2 | 15.9 | |
| Month | November | 6 | 6 | 20.7 | 4.2-10.3 | 40.6 | 1.6-5.2 | 31.3 | 1.9-2.9 | 66.7 | 11.9 |
| December | 6 | 6 | 22.0 | 5.8-9.7 | 59.4 | 3.0-5.5 | 55.6 | 5.8-6.4 | 90.5 | 20.3 | |
| January | 8 | 8 | 24.9 | 5.0-11.3 | 44.6 | 1.2-4.4 | 27.3 | 4.2-5.6 | 75.0 | 15.5 | |
| February | 8 | 8 | 30.1 | 5.3-11.0 | 48.5 | 2.2-5.8 | 37.1 | 4.0-5.1 | 77.4 | 16.8 |
Splits Stats - Ball control per game
| gp | gs | mpg | off/g | def/g | reb/g | pf/g | dq/g | ast/g | to/g | a/to | stl/g | blk/g | ||
|---|---|---|---|---|---|---|---|---|---|---|---|---|---|---|
| Event | Total | 28 | 28 | 24.9 | 1.3 | 3.8 | 5.1 | 2.0 | - | 1.0 | 1.5 | 0.7 | 0.6 | 0.1 |
| Conference | 20 | 20 | 26.6 | 1.6 | 4.0 | 5.6 | 2.0 | - | 1.1 | 1.4 | 0.7 | 0.8 | 0.1 | |
| Exhibition | 4 | 3 | 18.0 | 0.5 | 2.5 | 3.0 | 1.5 | - | 1.0 | 2.0 | 0.5 | 0.0 | 0.0 | |
| Location | Home | 14 | 14 | 24.8 | 1.3 | 3.9 | 5.1 | 2.1 | - | 1.3 | 0.9 | 1.5 | 0.3 | 0.2 |
| Away | 13 | 13 | 25.6 | 1.4 | 3.9 | 5.3 | 1.9 | - | 0.8 | 2.1 | 0.4 | 1.0 | 0.1 | |
| Neutral | 1 | 1 | 16.0 | 1.0 | 0.0 | 1.0 | 1.0 | - | 0.0 | 2.0 | 0.0 | 0.0 | 0.0 | |
| Result | Wins | 11 | 11 | 27.4 | 1.6 | 4.5 | 6.1 | 1.9 | - | 0.5 | 1.3 | 0.4 | 0.8 | 0.1 |
| Losses | 17 | 17 | 23.2 | 1.1 | 3.3 | 4.4 | 2.1 | - | 1.4 | 1.6 | 0.9 | 0.5 | 0.2 | |
| Month | November | 6 | 6 | 20.7 | 1.2 | 2.7 | 3.8 | 1.8 | - | 1.0 | 1.8 | 0.5 | 0.3 | 0.2 |
| December | 6 | 6 | 22.0 | 0.7 | 4.5 | 5.2 | 2.5 | - | 1.8 | 0.8 | 2.2 | 0.3 | 0.2 | |
| January | 8 | 8 | 24.9 | 1.5 | 3.8 | 5.3 | 2.1 | - | 0.4 | 1.1 | 0.3 | 0.6 | 0.1 | |
| February | 8 | 8 | 30.1 | 1.8 | 4.0 | 5.8 | 1.6 | - | 1.0 | 2.0 | 0.5 | 1.0 | 0.1 |
Splits Stats - Ball control totals
| gp | gs | min | off | def | reb | pf | dq | ast | to | a/to | stl | blk | ||
|---|---|---|---|---|---|---|---|---|---|---|---|---|---|---|
| Event | Total | 28 | 28 | 696 | 37 | 105 | 142 | 56 | - | 28 | 41 | 0.7 | 17 | 4 |
| Conference | 20 | 20 | 532 | 31 | 81 | 112 | 40 | - | 21 | 29 | 0.7 | 15 | 2 | |
| Exhibition | 4 | 3 | 72 | 2 | 10 | 12 | 6 | - | 4 | 8 | 0.5 | 0 | 0 | |
| Location | Home | 14 | 14 | 347 | 18 | 54 | 72 | 30 | - | 18 | 12 | 1.5 | 4 | 3 |
| Away | 13 | 13 | 333 | 18 | 51 | 69 | 25 | - | 10 | 27 | 0.4 | 13 | 1 | |
| Neutral | 1 | 1 | 16 | 1 | 0 | 1 | 1 | - | 0 | 2 | 0.0 | 0 | 0 | |
| Result | Wins | 11 | 11 | 301 | 18 | 49 | 67 | 21 | - | 5 | 14 | 0.4 | 9 | 1 |
| Losses | 17 | 17 | 395 | 19 | 56 | 75 | 35 | - | 23 | 27 | 0.9 | 8 | 3 | |
| Month | November | 6 | 6 | 124 | 7 | 16 | 23 | 11 | - | 6 | 11 | 0.5 | 2 | 1 |
| December | 6 | 6 | 132 | 4 | 27 | 31 | 15 | - | 11 | 5 | 2.2 | 2 | 1 | |
| January | 8 | 8 | 199 | 12 | 30 | 42 | 17 | - | 3 | 9 | 0.3 | 5 | 1 | |
| February | 8 | 8 | 241 | 14 | 32 | 46 | 13 | - | 8 | 16 | 0.5 | 8 | 1 |
Splits Stats - Ball control per 40 min
| gp | gs | mpg | off/40 | def/40 | reb/40 | pf/40 | dq/40 | ast/40 | to/40 | a/to | stl/40 | blk/40 | ||
|---|---|---|---|---|---|---|---|---|---|---|---|---|---|---|
| Event | Total | 28 | 28 | 24.9 | 2.1 | 6.0 | 8.2 | 3.2 | 0.0 | 1.6 | 2.4 | 0.7 | 1.0 | 0.2 |
| Conference | 20 | 20 | 26.6 | 2.3 | 6.1 | 8.4 | 3.0 | 0.0 | 1.6 | 2.2 | 0.7 | 1.1 | 0.2 | |
| Exhibition | 4 | 3 | 18.0 | 1.1 | 5.6 | 6.7 | 3.3 | 0.0 | 2.2 | 4.4 | 0.5 | 0.0 | 0.0 | |
| Location | Home | 14 | 14 | 24.8 | 2.1 | 6.2 | 8.3 | 3.5 | 0.0 | 2.1 | 1.4 | 1.5 | 0.5 | 0.3 |
| Away | 13 | 13 | 25.6 | 2.2 | 6.1 | 8.3 | 3.0 | 0.0 | 1.2 | 3.2 | 0.4 | 1.6 | 0.1 | |
| Neutral | 1 | 1 | 16.0 | 2.5 | 0.0 | 2.5 | 2.5 | 0.0 | 0.0 | 5.0 | 0.0 | 0.0 | 0.0 | |
| Result | Wins | 11 | 11 | 27.4 | 2.4 | 6.5 | 8.9 | 2.8 | 0.0 | 0.7 | 1.9 | 0.4 | 1.2 | 0.1 |
| Losses | 17 | 17 | 23.2 | 1.9 | 5.7 | 7.6 | 3.5 | 0.0 | 2.3 | 2.7 | 0.9 | 0.8 | 0.3 | |
| Month | November | 6 | 6 | 20.7 | 2.3 | 5.2 | 7.4 | 3.5 | 0.0 | 1.9 | 3.5 | 0.5 | 0.6 | 0.3 |
| December | 6 | 6 | 22.0 | 1.2 | 8.2 | 9.4 | 4.5 | 0.0 | 3.3 | 1.5 | 2.2 | 0.6 | 0.3 | |
| January | 8 | 8 | 24.9 | 2.4 | 6.0 | 8.4 | 3.4 | 0.0 | 0.6 | 1.8 | 0.3 | 1.0 | 0.2 | |
| February | 8 | 8 | 30.1 | 2.3 | 5.3 | 7.6 | 2.2 | 0.0 | 1.3 | 2.7 | 0.5 | 1.3 | 0.2 |
News Mentions

Men's Basketball Ends Season With 81-57 Loss At Ashland
February 24, 2018

Men's Basketball Earns 85-75 Overtime Win Over Tiffin
February 22, 2018

Men's Basketball Loses At Wayne State 87-73
February 17, 2018

Men's Basketball Loses To Northern Michigan 80-72
February 8, 2018

Men's Basketball Falls At Lake Superior State 82-61
February 3, 2018
Men's Basketball Defeats Saginaw Valley 68-64
January 27, 2018

Northwood Posts Fourth Straight Win - Downs Ashland 74-64
January 20, 2018

Men's Basketball Claims 92-81 Win Over Tiffin
January 18, 2018

Men's Basketball Drops 55-52 Contest At Purdue Northwest
January 6, 2018

Men's Basketball Falls To Lewis 89-72
December 30, 2017
Men's Basketball Defeats Wisconsin-Parkside 81-68
December 19, 2017

Men's Basketball Falls To Saginaw Valley 64-53
December 16, 2017
Men's Basketball Falls At Michigan Tech 87-70
December 2, 2017
Photos


